
Space Utilization: What Your Building Data Is Trying to Tell You
Most facility and space managers have a sense that their buildings are underused. The meeting rooms that are always “booked” but rarely full. The open-plan floors that empty out by 2pm. The common areas that justify their square footage for about ninety minutes a day.
The problem is not that this data does not exist. The problem is that most organisations are not capturing it in a way that makes it actionable.
This post looks at what space utilization data actually is, why it matters more than most FM teams realise, and what a practical approach to capturing and using it looks like.
What Space Utilization Data Actually Means
Space utilization is not the same as occupancy. That distinction matters.
Occupancy tells you whether a space is booked. Utilization tells you whether it is actually being used — and by how many people, for how long, at what times.
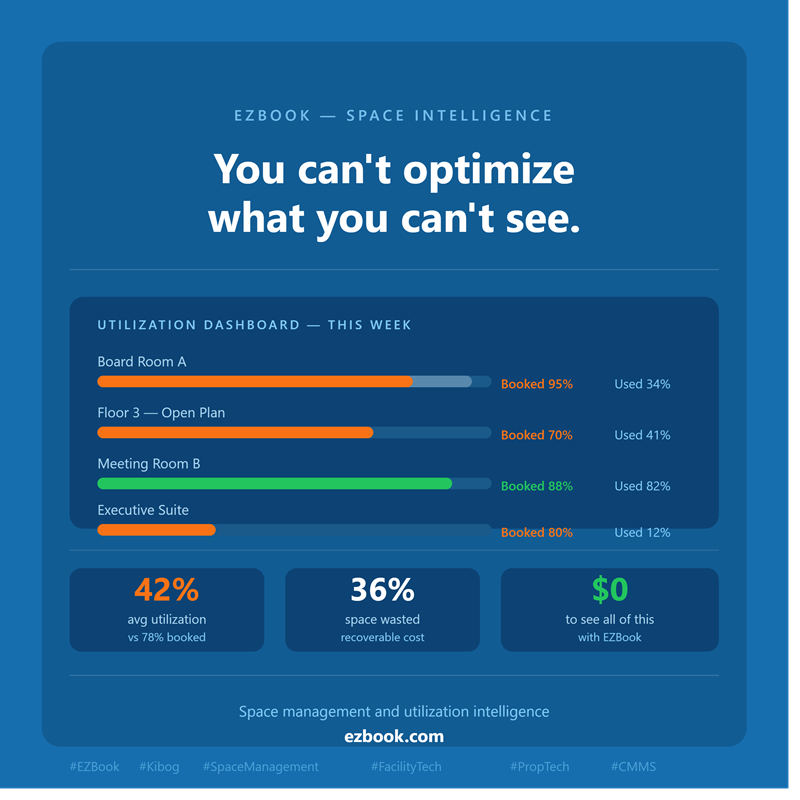
A meeting room booked for eight people that consistently runs with three has 100% occupancy and 37.5% utilization. Those are very different numbers with very different implications for how you allocate, maintain, and plan your space.
Most booking systems capture occupancy well. Very few capture actual utilization — and that gap is where the most useful facility data lives.
Why the Gap Between Booked and Used Is So Costly
When organizations plan their facilities based on booking data rather than utilization data, they consistently over-allocate space. This has cascading costs:
- Real estate costs — maintaining square footage that is not genuinely needed is one of the most significant and least examined cost lines in a facilities budget
- Energy costs — HVAC, lighting, and building systems running at full capacity for spaces that are partially or intermittently occupied
- Maintenance costs — preventative maintenance schedules built around assumed usage rather than actual usage, leading to over-servicing in some areas and under-servicing in others
- Capital planning errors — renovation and expansion decisions made on the basis of perceived demand rather than demonstrated need
A 2022 workplace utilization study by JLL found that the average corporate office is used at between 40% and 60% of its theoretical capacity on any given day. For most organizations, that represents a significant and largely invisible cost.
The Three Things Utilization Data Tells You
When you start capturing genuine utilization data — not just bookings, but actual presence and usage patterns — three things become visible that were previously invisible:
1. Where your highest-demand spaces are
Some rooms and areas are consistently in demand and genuinely fully used. Others appear in demand on paper but are routinely underused in practice. Knowing the difference lets you direct investment, maintenance, and configuration toward what is actually needed.
2. When your buildings are genuinely occupied
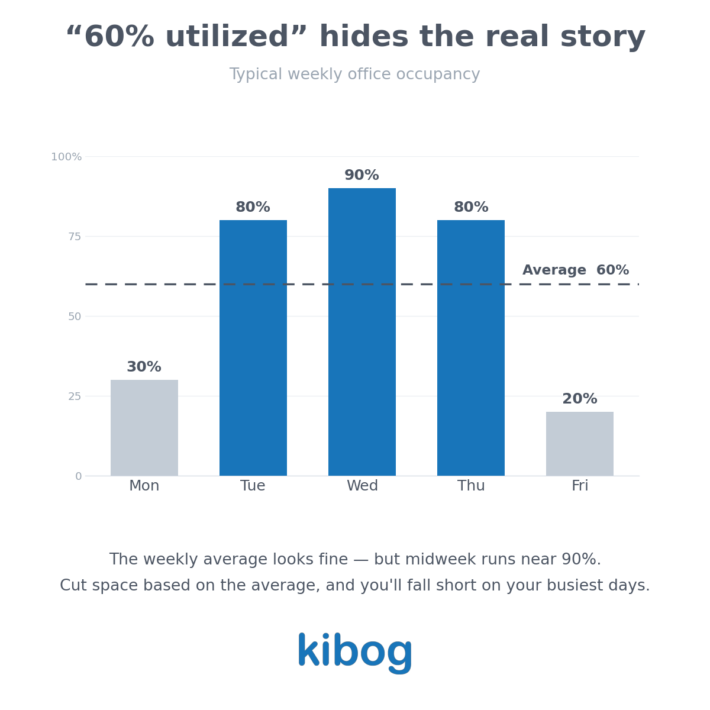
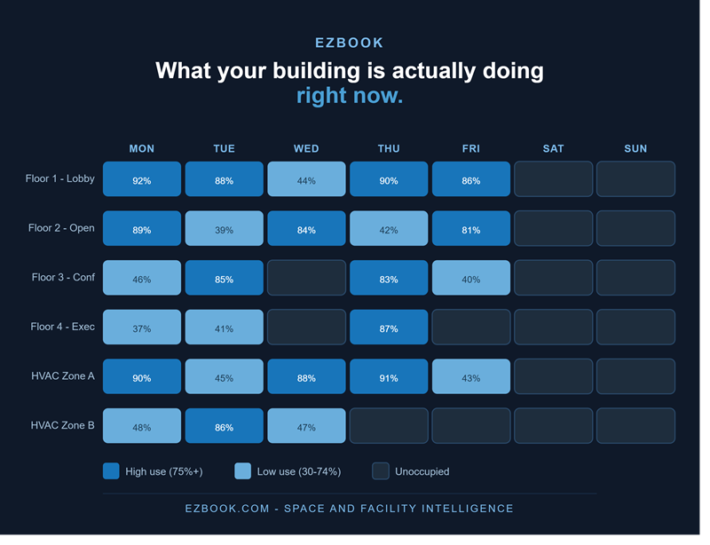
Peak utilization windows are almost always narrower than facility managers assume. Understanding when your buildings are actually busy — by floor, by zone, by day of week — allows for much more precise energy management, cleaning schedules, and maintenance timing.
3. What your space portfolio should actually look like
Over time, utilization data builds the evidence base for right-sizing your space portfolio — whether that means consolidating underused floors, reconfiguring room sizes to match actual meeting patterns, or making the case for expansion in areas of genuine demonstrated demand.
What a Practical Utilization Tracking Approach Looks Like
You do not need sensor infrastructure or a complex IoT deployment to start capturing meaningful utilization data. A structured booking system with check-in confirmation and post-booking usage logging captures the most important signals:
- Booking vs check-in rate — what percentage of bookings result in actual use
- Actual attendee count vs booked capacity — captured at check-in or through a simple post-meeting confirmation
- No-show rate by room type and time slot — identifies the booking patterns that most distort your utilization picture
- Peak usage windows by floor and zone — tells you when your building is actually busy
EZBook captures all of these data points as a natural output of the booking workflow — without requiring separate sensor systems or manual reporting processes. The utilization picture builds automatically as your teams use the platform.
From Data to Decisions
The value of utilization data is not in the reporting. It is in what it changes about how you make decisions.
Facility managers who have genuine utilization visibility consistently report the same shifts: maintenance schedules become more precise, energy management becomes more targeted, capital planning becomes more defensible, and the ongoing conversation with building owners and senior leadership about space costs becomes data-driven rather than anecdotal.
The space is the same. The building is the same. What changes is what you can see — and therefore what you can act on.
Getting Started
If your organisation is currently managing space primarily through booking data, the starting point is simple: add utilization tracking to your existing booking workflow. Even basic check-in confirmation and post-booking usage logging will immediately begin producing a more accurate picture of what is actually happening in your buildings.
EZBook is designed to make this straightforward — a space management and booking platform that captures utilization data as a natural part of how your teams book and use space, without adding complexity to their workflow.
If you would like to see how it works in practice, explore EZBook at ezbook.com or get in touch to discuss your specific space management challenge.
EZBook is also the platform foundation behind Kibog’s work-order and asset management delivery — built by operators who understand what facility data needs to do in the real world.